(37)
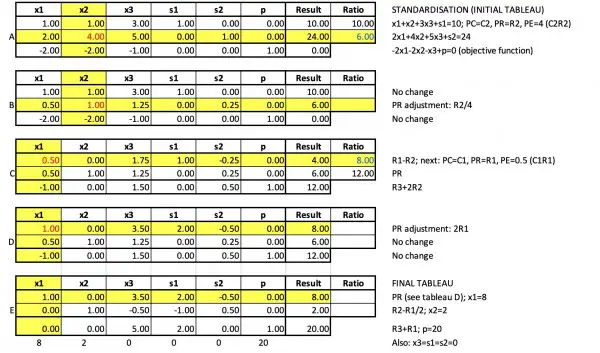
Standardise:
-x1-x2+p=0 (objective function)
2x1+x2+s1=16
x1+s2=6
x2+s3=10, where the s variables are slack variables to convert inequalities into equations.
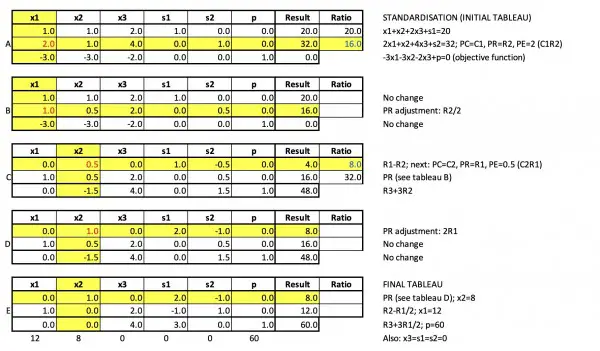
The following initial tableau of coefficients is labelled A in the picture below:
We take column 1 (C1) as the pivot column, as advised. To find the pivot row (PR) use values in R1 and R2 of PC, evaluate Ratio by dividing into the corresponding Result row. The lower value (blue) establishes PR. The pivot element (PE) is in PR and PC, that is, 1 (red). Yellow highlights PR and PC.
The next step would normally be a row operation to make the PE=1, but it's already 1. So the next step (tableau B) is to perform row manipulation to force zeroes into other rows in PC.
R1→R1-2PR; R4→R4+PR. No changes to other rows.
We repeat the process until there are no negatives in R4. So C2 is PC and Ratio shows that R1 is PR, and red 1 is PE.
We need R3 and R4 in PC to be zero through row manipulation: R3→R3-PR, R4→R4+PR (tableau C).
We still have a negative in R4 so PC=C4. 3 (blue) is the smallest positive Ratio, so PR=R3.
PE=2 so we need to adjust PR by halving the elements of R3 so that PE=1 (tableau D).
R1, R2, R4 need to be zero in PC (C4). So R1→R1+2R3; R2→R2-R3; R4→R4+R3. Because there are no negatives in R4, this takes us to the final tableau E in which the solution appears.
So x2=10, x1=3, p=13 is the solution. s2=3 is part of the solution because it satisfies the equation x1+s2=6, and is the "slack" or margin between x1 and its maximum permissible value of 6.
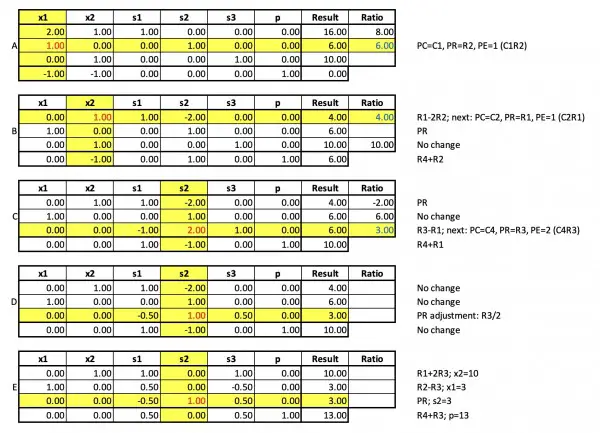
Below is the result of starting with pivot column 2 instead of 1, and this time only 4 transitional tableaux are needed to arrive at the solution. I've abbreviated the process having already given greater detail above for starting with pivot column 1. The final result is exactly the same. These tableaux are transitional, that is, most of them combine two steps in one tableau, hence "next" in the description which shows the new PR and PC for the next operation.
There are a number of questions in your submissions and it will take some time to prepare answers and presentation for each. The website imposes size and upload restrictions.
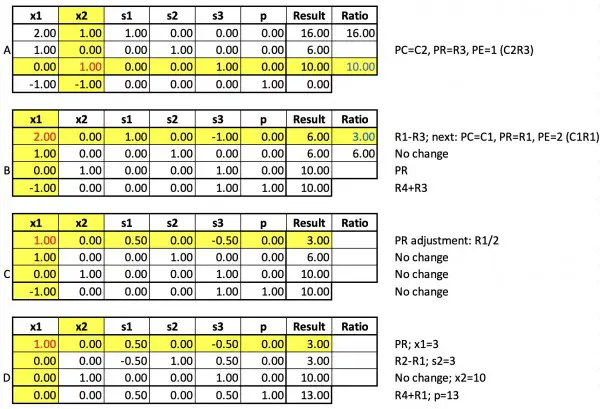
(38)
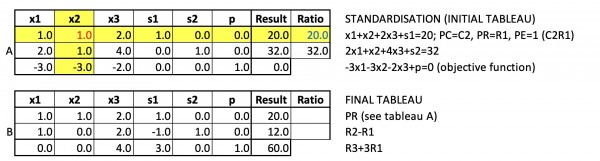
Column 1 is the first pivot column.
Column 2 is the first pivot column.

(39)
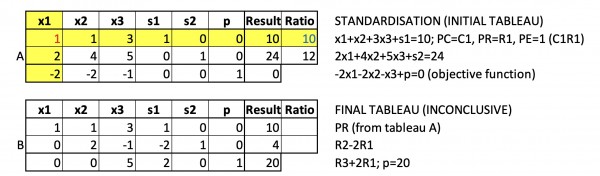
Column 1 is the initial pivot column.
Column 2 is the initial pivot column.
From the final tableau p=60 and x1=12, but it would appear that we can't directly see the values of other two variables, because we don't have a row in which x2 appears isolated from the other variables. This anomaly leads us to accept the solution in which C1 was the initial PC.
Also, because x3 doesn't have the coefficient 1 anywhere in the tableaux, we assume x3=0. If we similarly accept s1 and s2 as being zero, we can deduce from R1 that x1+x2=20, so x2=8. This value also satisfies p=3x1+3x2+2x3=36+24+0=60. However, if x3=0, then effectively we have x1+x2≤20 and p=3x1+3x2=3(x1+x2)=3×20 (where 20 is the maximum sum of the two variables).
Further analysis shows that x2=8 independent of the other variables:
x2≤20-x1-2x3, so 2x2≤40-2x1-4x3, but x2≤32-2x1-4x3. If we consider the equations 2x2=40-2x1-4x3 and x2=32-2x1-4x3, then x2=8. If we make x2 7 or 9, for example, we get 7=8 or 9=8, which are false. The consequence of x2=8:
p=3x1+24+2x3, x1+2x3≤20-8, 2x1+4x3≤32-8, that is, x1+2x3≤12 and 2x1+4x3≤24, which are identical inequalities, making x1≤12-2x3. Both C1 and C2 arrive p=60, so we know that 3x1+2x3=60-24=36, which dictates that x1=12 and x3=0.
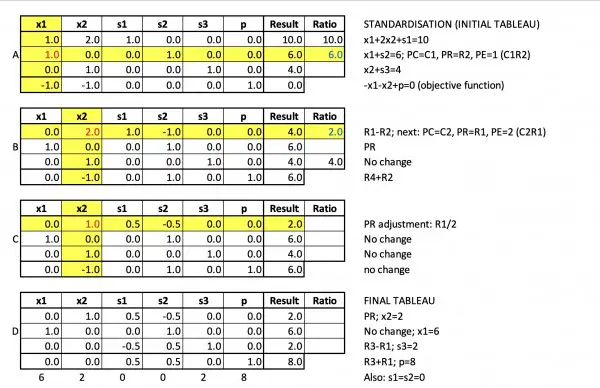
(40)
Column 1 is the pivot column.
Column 2 is the pivot column.